Visualising My GitHub Activity as an Interactive Graph
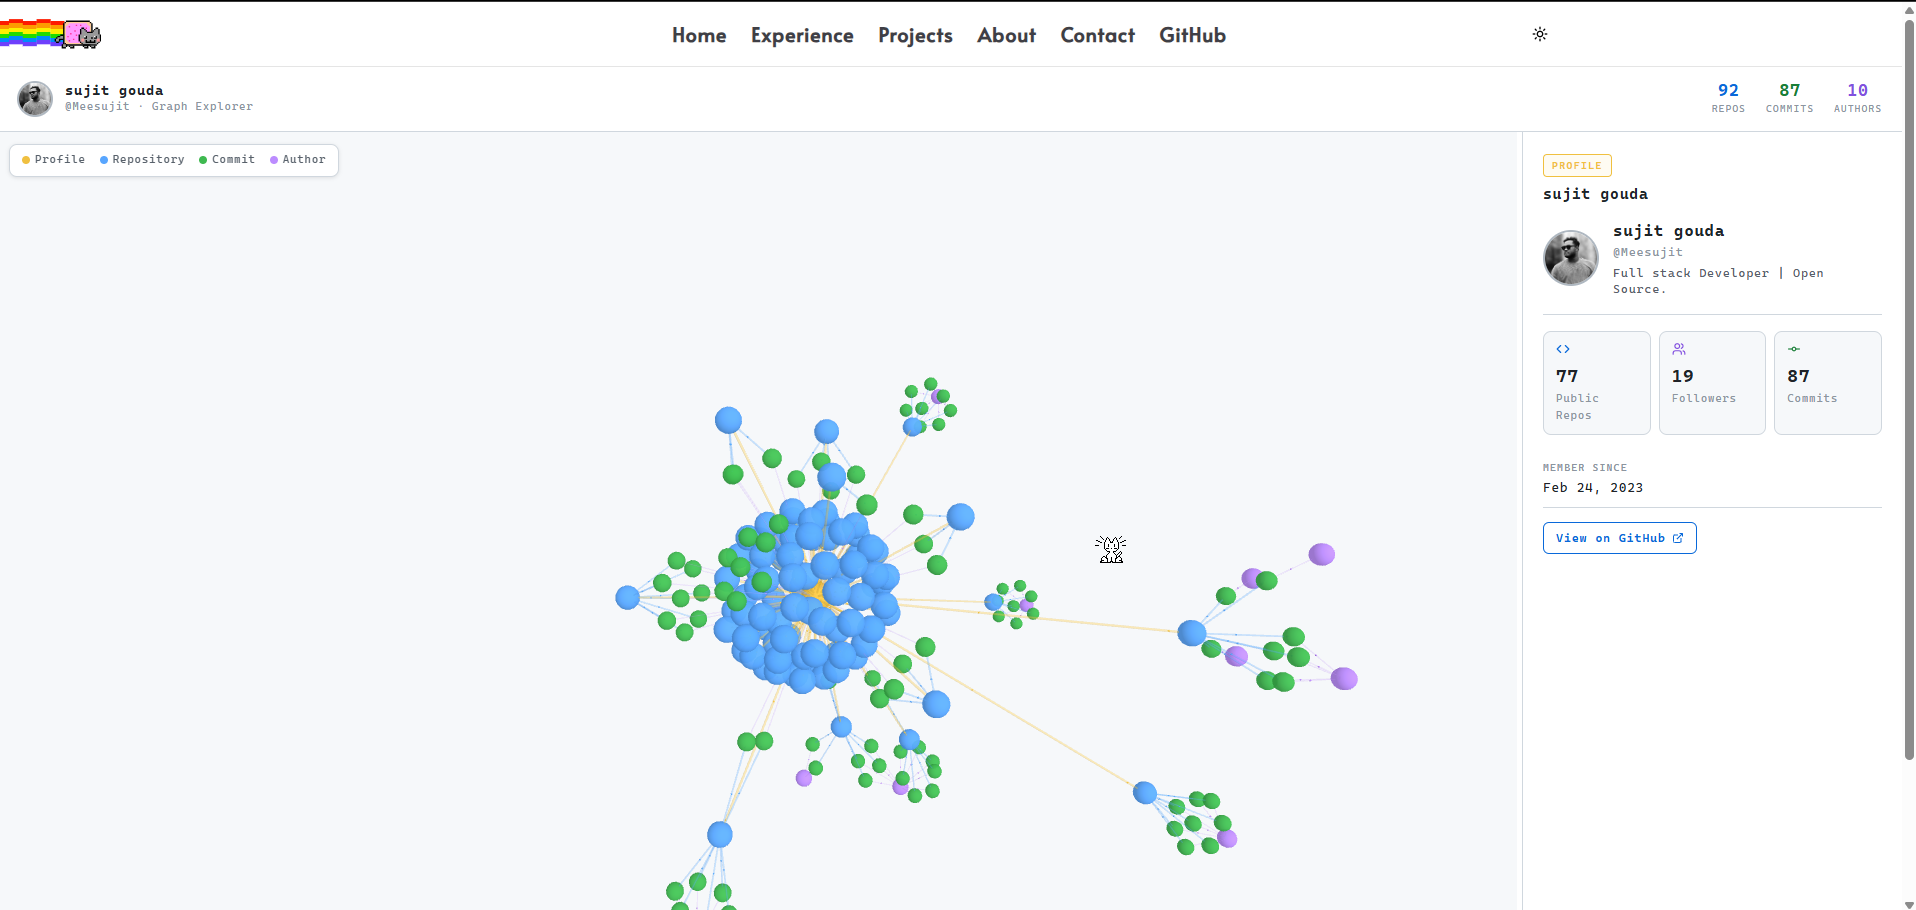
I wanted a way to show my GitHub activity that wasn't just a list of repos. So I built an interactive 3D graph that maps out every repository, commit, and contributor — all connected by live edges you can drag around and explore.
Here's exactly how it works and what I used to build it.
Packages
npm install react-force-graph-3d next-themes lucide-react| Package | What it does |
|---|---|
react-force-graph-3d |
Renders the 3D WebGL force graph using Three.js |
next-themes |
Dark / light theme switching |
lucide-react |
Icons in the detail panel |
How the Graph Works
The graph is a force-directed network — nodes repel each other and edges pull connected nodes together until the whole thing settles into a natural layout. There are four node types:
- 🟡 Profile — the centre node, your GitHub account
- 🔵 Repo — one node per repository
- 🟢 Commit — one node per recent commit
- 🟣 Author — one node per contributor
The edges connect them in a hierarchy:
Profile → Repo → Commit → Author
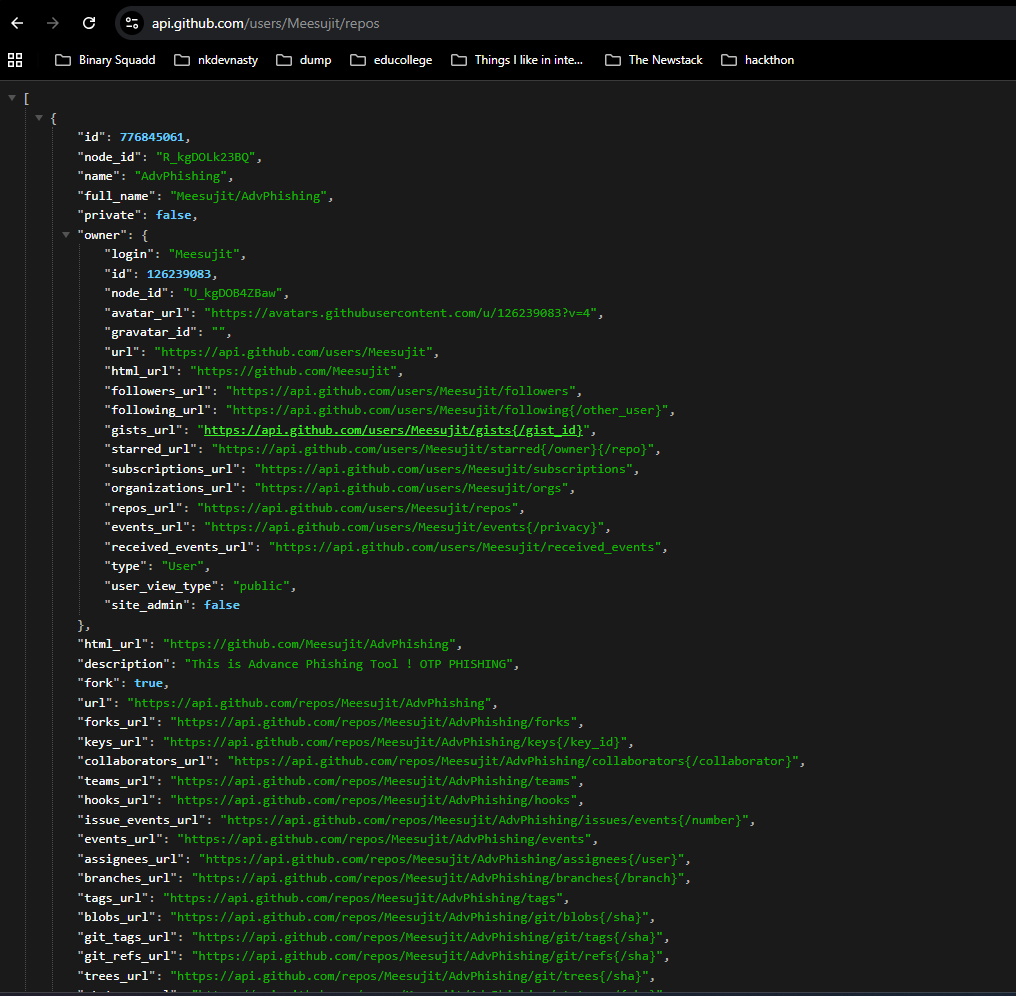
Fetching the Data
All data comes from the GitHub REST API. The route runs server-side so the token stays private.
Getting all repos including private ones:
Most examples use /users/{username}/repos which only returns public repos. The authenticated /user/repos endpoint returns everything:
// ❌ Public only
fetch(`https://api.github.com/users/Meesujit/repos`)

// ✅ Public + Private
fetch(`https://api.github.com/user/repos?visibility=all&affiliation=owner`, {
  headers: { Authorization: `Bearer ${process.env.GITHUB_TOKEN}` }
})
Your token needs the repo scope (not just public_repo) for private repos to appear.
Fetching commits without hitting rate limits:
Fetching all commits at once triggers GitHub's secondary rate limit. The fix is batching — 5 repos at a time with a short delay between each batch:
async function batchFetch(repos, fetchFn, batchSize = 5, delay = 150) {
  const results = {};
  for (let i = 0; i < repos.length; i += batchSize) {
    const batch = repos.slice(i, i + batchSize);
    const settled = await Promise.allSettled(batch.map(fetchFn));
    settled.forEach((res, idx) => {
      if (res.status === "fulfilled") results[batch[idx]] = res.value;
    });
    if (i + batchSize < repos.length)
      await new Promise(r => setTimeout(r, delay));
  }
  return results;
}
Building the Graph Data
The raw API response gets transformed into { nodes, links } — the format react-force-graph-3d expects:
function buildGraph(user, repos, commitsMap) {
  const nodes = [];
  const links = [];

  // Centre node — the profile
  nodes.push({ id: user.login, type: "profile", size: 14 });

  for (const repo of repos) {
    nodes.push({ id: repo.name, type: "repo", size: 8, repo });
    links.push({ source: user.login, target: repo.name });

    for (const commit of commitsMap[repo.name] ?? []) {
      nodes.push({ id: commit.sha, type: "commit", size: 3, commit });
      links.push({ source: repo.name, target: commit.sha });

      if (commit.author) {
        nodes.push({ id: commit.author.login, type: "author", size: 5 });
        links.push({ source: commit.sha, target: commit.author.login });
      }
    }
  }

  // Same author can appear across many commits — deduplicate
  return { nodes: dedupeById(nodes), links };
}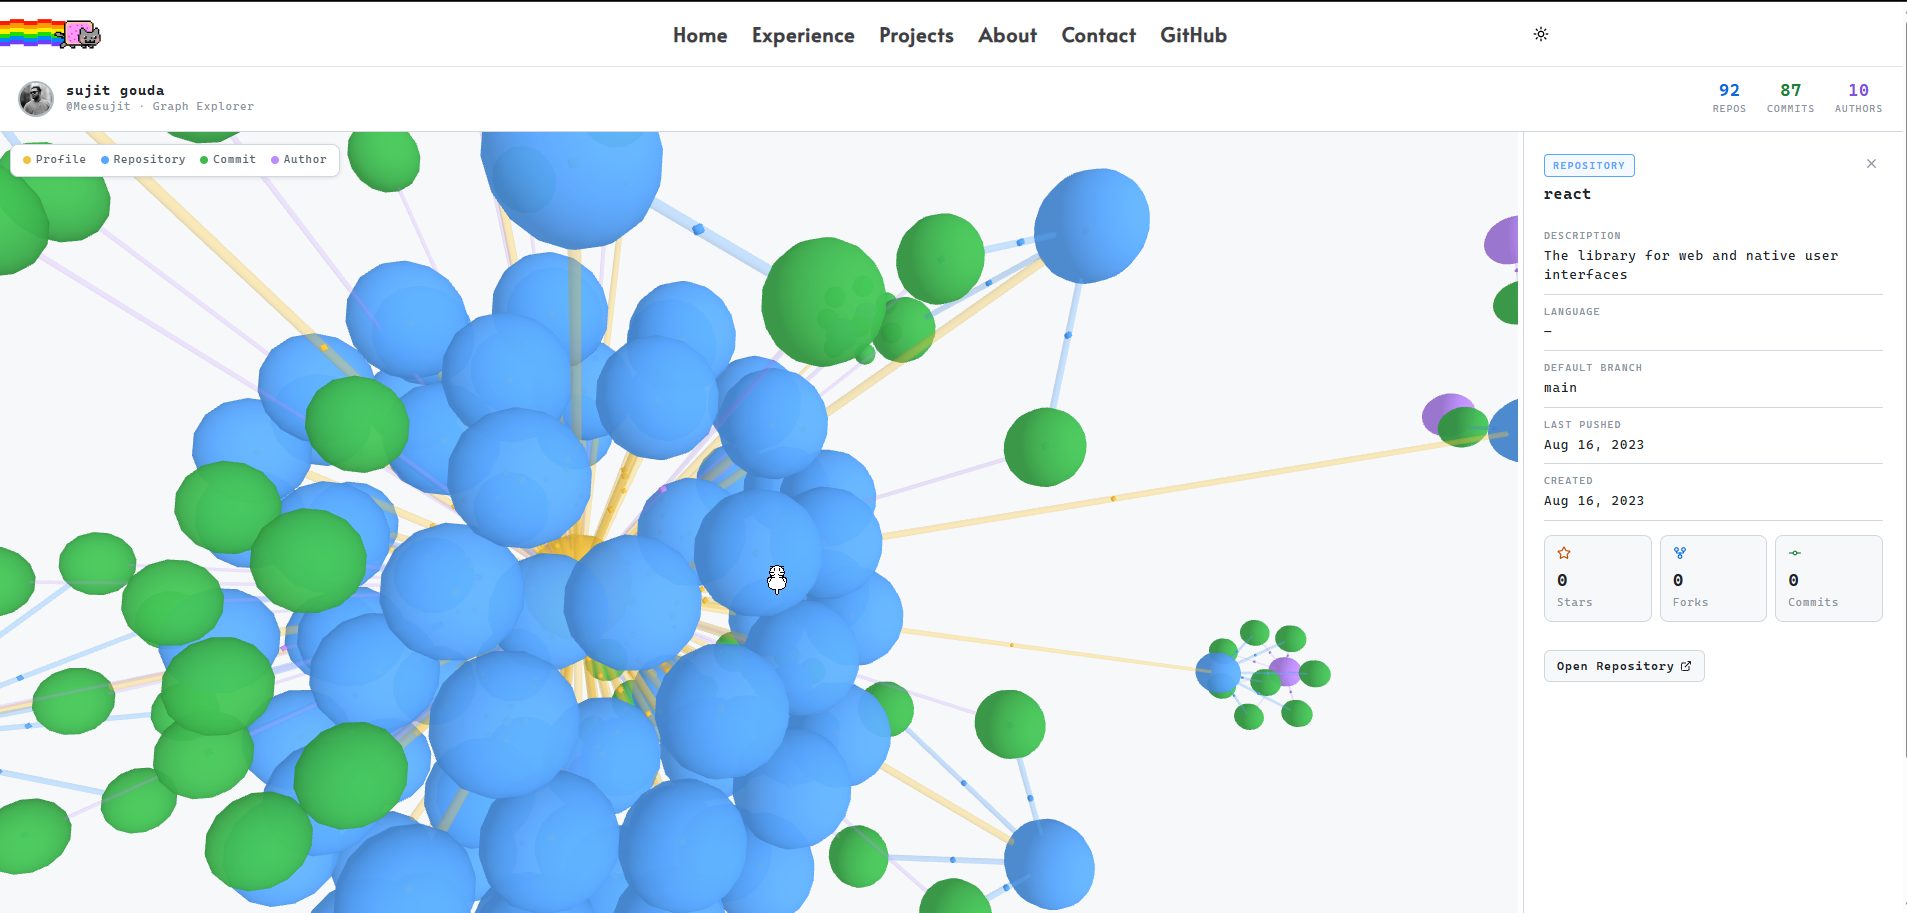
Rendering the Graph
Because react-force-graph-3d uses WebGL, it must load client-side only:
const GitHubGraph = dynamic(
  () => import("@/components/graph"),
  { ssr: false }
);
The component:
<ForceGraph3D
  graphData={graphData}
  nodeRelSize={5}
  nodeVal={n => n.size ?? 4}
  nodeColor={n => NODE_COLORS[n.type]}
  nodeOpacity={0.95}
  nodeResolution={16}
  linkColor={l => linkColors[l.type]}
  linkWidth={l => l.type === "profile-repo" ? 1.8 : 1.2}
  linkDirectionalParticles={2}
  linkDirectionalParticleSpeed={0.004}
  onNodeClick={handleNodeClick}
  enableNodeDrag
/>
linkDirectionalParticles adds animated dots travelling along each edge — makes the graph feel alive rather than static.
Node colours are consistent across both themes:
const NODE_COLORS = {
  profile: "#f0c040",  // gold
  repo:    "#58a6ff",  // blue
  commit:  "#3fb950",  // green
  author:  "#bc8cff",  // purple
};
Clicking a node flies the camera to it smoothly:
function handleNodeClick(node) {
  const distance = 90;
  const ratio = 1 + distance / Math.hypot(node.x, node.y, node.z);
  graphRef.current?.cameraPosition(
    { x: node.x * ratio, y: node.y * ratio, z: node.z * ratio },
    { x: node.x, y: node.y, z: node.z },
    900 // ms
  );
}
The Contribution Calendar
The calendar in the profile panel is built from scratch — no library. It groups commit dates into a 52-week grid and maps counts to four intensity levels, exactly like GitHub does.
function cellColor(count, maxCount) {
  if (count === 0) return "#161b22";
  const level = Math.ceil((count / maxCount) * 4);
  return ["#0e4429", "#006d32", "#26a641", "#39d353"][level - 1];
}
The grid is a flex layout of 11×11px divs — one per day, 7 rows per column:
{weeks.map((week, wi) => (
  <div key={wi} style={{ display: "flex", flexDirection: "column", gap: 2 }}>
    {week.map(day => (
      <div
        key={day.date}
        title={`${day.date}: ${day.count} commits`}
        style={{
          width: 11, height: 11,
          borderRadius: 2,
          background: cellColor(day.count, max)
        }}
      />
    ))}
  </div>
))}
Dark / Light Theme
All colours live in a single tokens() function. Every style reads from t, so swapping theme is one re-render — no scattered hardcoded values anywhere:
function tokens(dark) {
  return dark ? {
    bg: "#0a0a0a", surface: "#111111",
    border: "#1e1e1e", text: "#e8e8e8",
    calEmpty: "#161b22", calL4: "#39d353",
  } : {
    bg: "#ffffff", surface: "#ffffff",
    border: "#d0d7de", text: "#1f2328",
    calEmpty: "#ebedf0", calL4: "#216e39",
  };
}
next-themes handles persistence and OS preference detection from layout.tsx:
<ThemeProvider attribute="class" defaultTheme="system" enableSystem>
  {children}
</ThemeProvider>
A mounted guard in the graph component prevents a colour flash on first render:
const [mounted, setMounted] = useState(false);
useEffect(() => { setMounted(true); }, []);
if (!mounted) return null;
That's the whole thing. Two packages, one API route, one component. The graph pulls live data, handles rate limits, includes private repos, and adapts to the user's theme automatically.